
Reinsurance softens while physical signals build.

TL;DR
Property catastrophe reinsurance pricing is softening 15-20%+ at mid-year renewals, even as Allstate – an insurer – has booked $870m of April catastrophe losses, NOAA puts El Niño emergence at 82% within weeks, and a tenth of Nebraska is now in exceptional drought. This is the same pricing-versus-physical gap we have tracked in wheat futures and food CPI, now visible in the insurance market at much larger capital scale.
This week’s top briefs
Property catastrophe reinsurance pricing down 15-20%+ at mid-year
Summary: Aditya Dutt, President of Aeolus Capital Management, told Jefferies analysts that property catastrophe reinsurance prices at the mid-2026 renewals (1 June and 1 July) are tracking 15-20%+ lower than a year ago. This accelerates a trend already in motion: prices fell 14.7% at the January 2026 renewals, the largest annual drop since 2014. AM Best has separately forecast more pronounced softening at the June renewal. Critically, the price is falling even as demand is rising: RenaissanceRe’s Chief Underwriting Officer revised his forecast for new 2026 reinsurance demand from $10bn to $15bn this quarter.
Key data: Three consecutive years of declining reinsurance prices: -2.0% (2024), -8.0% (2025), -14.7% (January 2026), now tracking -15 to -20%+ at mid-2026. New demand projection up 50% in three months. The softening is happening despite demand structurally elevated and despite six consecutive years of insured catastrophe losses above $100bn globally.
Why it matters: When reinsurance gets cheaper, primary insurers should – in theory – be able to offer their customers better terms too. But that pass-through does not necessarily materialise. US home insurance premiums are up 107.6% since 2019 per Rate Insurance, moving in the opposite direction from the wholesale market. The key question is whether the next 12 months represent a structural reduction in physical risk, or a capital-flow cycle that will reverse abruptly when a major loss event prints. The historical pattern points to the latter.
Read: Artemis – Mid-year renewals seen down 15-20%+, Dutt/Aeolus · Artemis – RenRe stronger reinsurance demand
Allstate has already booked $870m of April catastrophe losses
Summary: Allstate disclosed pre-tax catastrophe losses of $870m for April 2026 alone, the start of its 2026 annual aggregate risk period. The disclosure was the largest in a sequence of insurer cat-loss announcements published during the same week that the Aeolus pricing commentary landed.
Key data: Allstate April 2026 cat losses of $870m.
Why it matters: The gap between wholesale reinsurance softening and retail premium hardening is the asymmetry we are tracking. Even more fundamental is how this gap will close.
Read: Artemis – Allstate Q1 2026 cat losses · Insurance Business America – Home insurance premiums +107.6% since 2019
MS Amlin: 56% of planned US data centres sit in catastrophe-exposed states
Summary: Lloyd's specialty insurer MS Amlin published a proprietary analysis of 670 planned US data centre projects representing nearly $800bn in investment. 56% are located in states highly exposed to hurricanes, severe convective storms, earthquakes or winter storms. Within that, 27% ($440bn of investment) are in winter-storm-exposed states; 21% ($340bn) in hurricane-exposed states. The shift is structural: hyperscale facilities are following land availability into southern regions where catastrophe exposure is high.
Key data: 56% of 670 planned facilities at high risk; $800bn total investment exposure. Existing data centres in severe-convective-storm-exposed states are valued at ~$20bn. This means planned AI infrastructure could increase at risk value by ~40×. Martin Burke, MS Amlin Chief Underwriting Officer: “When assets of this scale cluster in hazard-prone regions, the potential loss severity from a single storm event becomes very significant.”
Why it matters: Hyperscaler capex is hitting historical highs and geographical decisions are more influenced by tax incentives and political agendas than physical risks.
Read: Artemis – MS Amlin data centre analysis · Global Reinsurance – MS Amlin storm exposure
Nebraska wheat: abandonment expected at 36% of planted, up from 15% last year
Summary: Nebraska’s winter wheat farmers could be abandoning much of their crop this year. The latest US Drought Monitor reading shows almost 10% of the state in exceptional drought (D4) – the most severe classification – more than doubled from 4% recorded in the first week of May. Intermittent freezes after a warm period stressed crops at critical development phases.
Key data: 64% of planted wheat acres expected to be harvested in 2026, down from 85% in 2025. USDA Crop Progress: 0% excellent, 5% good, 13% fair, 45% poor, 37% very poor. State-level D4 coverage doubled in two weeks. Nine Nebraska counties were already under USDA disaster designation from the 2025 season; the 2026 designation process is accelerating.
Why it matters: Nebraska is the second-largest US winter wheat producer after Kansas. The 21-percentage-point drop in expected harvest rate compounds the WASDE production cut covered last week (smallest US wheat crop since 1972).
Read: Nebraska Public Media – Drought pushing wheat abandonment · University of Nebraska CropWatch
El Niño emergence reaches 82% probability with 65% chance of strong-or-stronger by October
Summary: NOAA’s Climate Prediction Center upgraded their prediction: El Niño emergence probability for May-July 2026 is now 82%; persistence through December 2026 – February 2027 is at 96%. Ocean temperature readings – a key indicator – have surged from near-neutral to above +0.9°C in recent weeks, indicating a clear shift to El Niño. The strong-or-stronger probability by October sits at 65%.
Key data: May-July emergence 82%, December-February peak 96%. Strong-plus probability by October 65%, with “very strong” (≥2°C anomaly) now the single most likely outcome for late 2026 according to NOAA.
Why it matters: El Niño is the underlying climate condition that shapes most of the agricultural and water-allocation risks we have been tracking (cocoa West Africa rainfall, coffee Brazil/Colombia weather, Indian monsoon, US Plains drought, Panama Canal water levels). The probability shift from “developing” to “imminent” is the most consequential climate macro signal since the beginning of the year. This is the climate-side macro signal building underneath food and energy.
Read: NOAA CPC ENSO Diagnostic Discussion (14 May 2026) · NOAA Coral Reef Watch – ENSO current conditions
Adaptation Best Practice – Jamaica’s third cat bond: $200m, post-Melissa
Hazard: Atlantic named storms and hurricanes; sovereign-scale parametric cover for fast-response liquidity.
What they did: The Government of Jamaica returned to the catastrophe bond market at the end of April with a $150m target for the IBRD CAR Jamaica 2026 issuance, intended to replace the $150m coverage triggered by Hurricane Melissa in October 2025. Investor demand was strong: the offering was upsized by one-third to $200m, priced within initial guidance at a 6.75% risk margin, and listed on the Singapore Exchange. The notes will run across four hurricane seasons through May 2030. World Bank IBRD as issuer; Insurance Linked Securities funds as primary investors.
Outcome: $200m of parametric named storm and hurricane protection at a 2.48% initial expected loss. The cover provides Jamaica with capital-markets-supported per-occurrence protection. This means, like the $150m Melissa payout, future major storms trigger payment within weeks rather than indemnity-cycle months. This is Jamaica’s largest cat bond placement to date, third in succession (2021: $185m; 2024: $150m, paid out post-Melissa; 2026: $200m).
Why this matters: Sovereign-scale parametric is now demonstrably durable through a full payout-and-renewal cycle. The Melissa payout proved the trigger architecture; the upsized 2026 placement at lower-half guidance proves investor appetite is intact after a payout, both essential preconditions for the approach to be replicable elsewhere.
Source: Artemis – Jamaica $200m cat bond priced · Artemis – Jamaica upsized $200m target · World Bank IBRD pricing announcement (May 2026)
Data Snapshot — Opposing market and physical trajectories
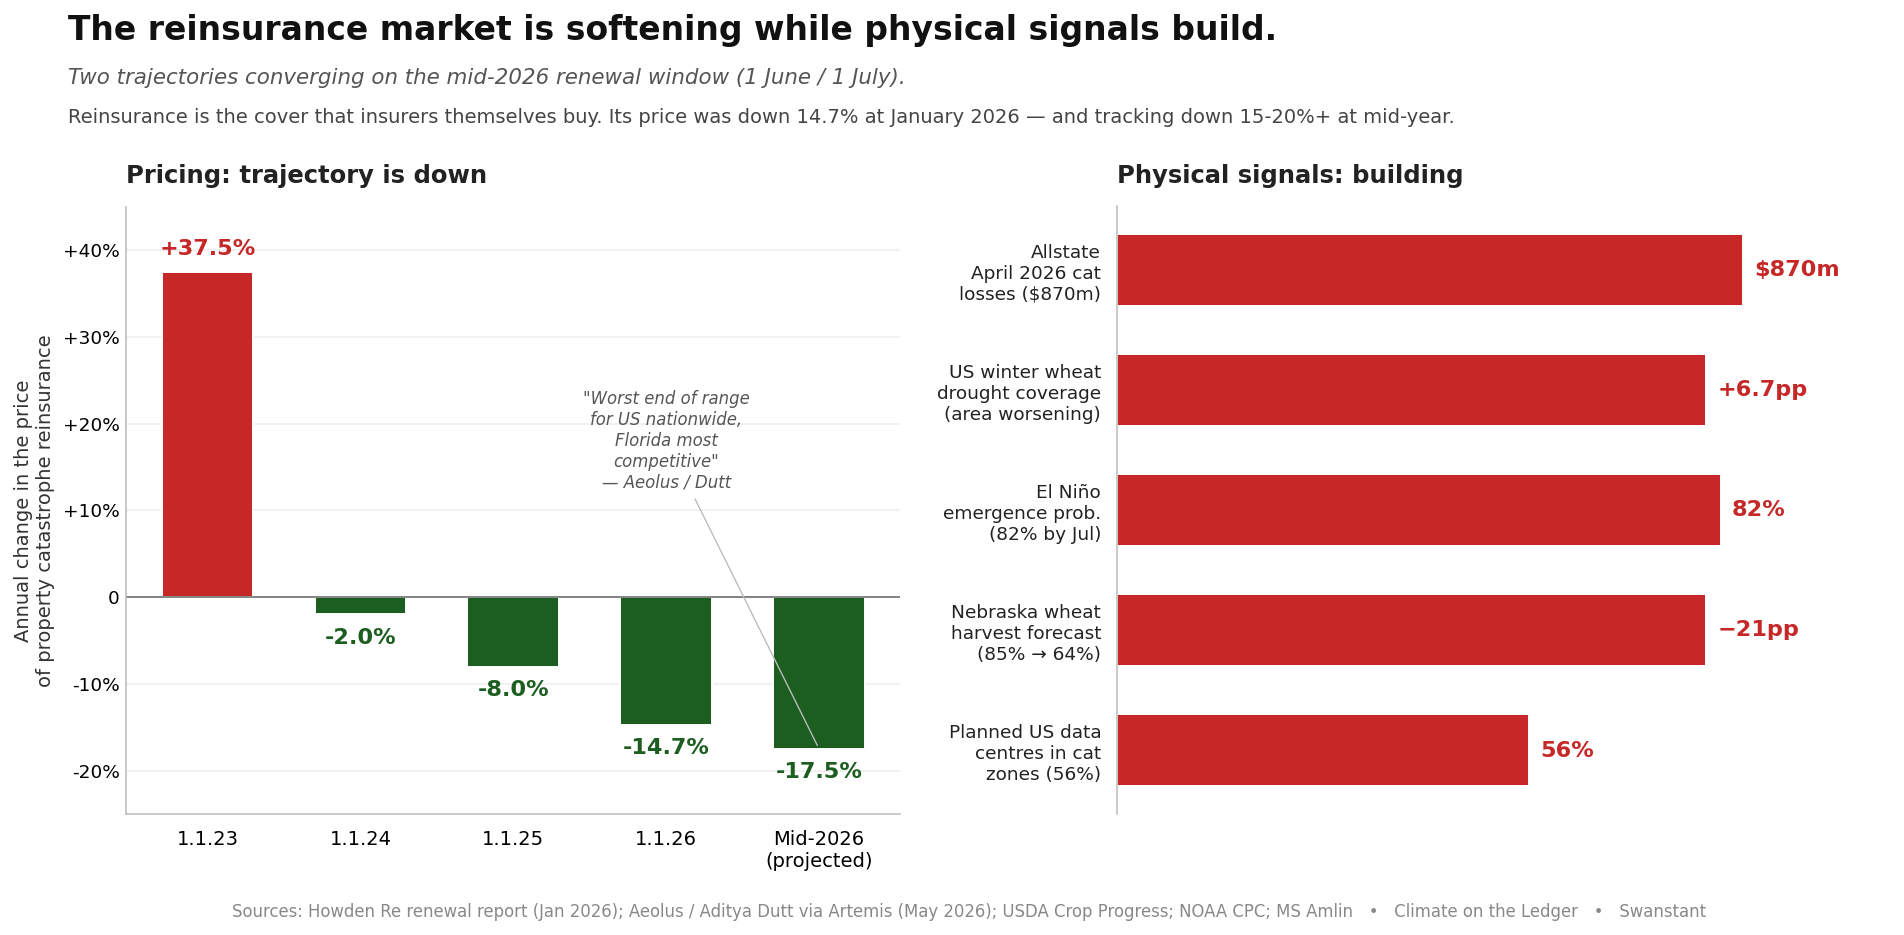
What it shows:
Reinsurance pricing has fallen for three consecutive renewal cycles, accelerating each time. The mid-2026 projection at -17.5% represents the steepest single decline on the trajectory.
The physical signals are building up. Allstate’s $870m of April losses, the doubling of Nebraska exceptional drought coverage in two weeks, the NOAA upgrade to El Niño Watch, and the MS Amlin data centre exposure analysis all landed in the same week.
Methodology: Rate-on-line trajectory from Howden Re renewal report (January 2026) for historical data, Aeolus / Aditya Dutt commentary via Artemis (May 2026) for the mid-2026 projection (midpoint of stated -15% to -20%+ range). Physical signals sourced from named primary references: Allstate disclosure via Artemis, USDA Drought Monitor (May 2026), NOAA CPC ENSO Diagnostic Discussion (14 May 2026), Nebraska Extension via Nebraska Public Media, MS Amlin proprietary analysis. Physical signals are not on a common scale; they are placed side-by-side as concurrent data points rather than directly comparable magnitudes.
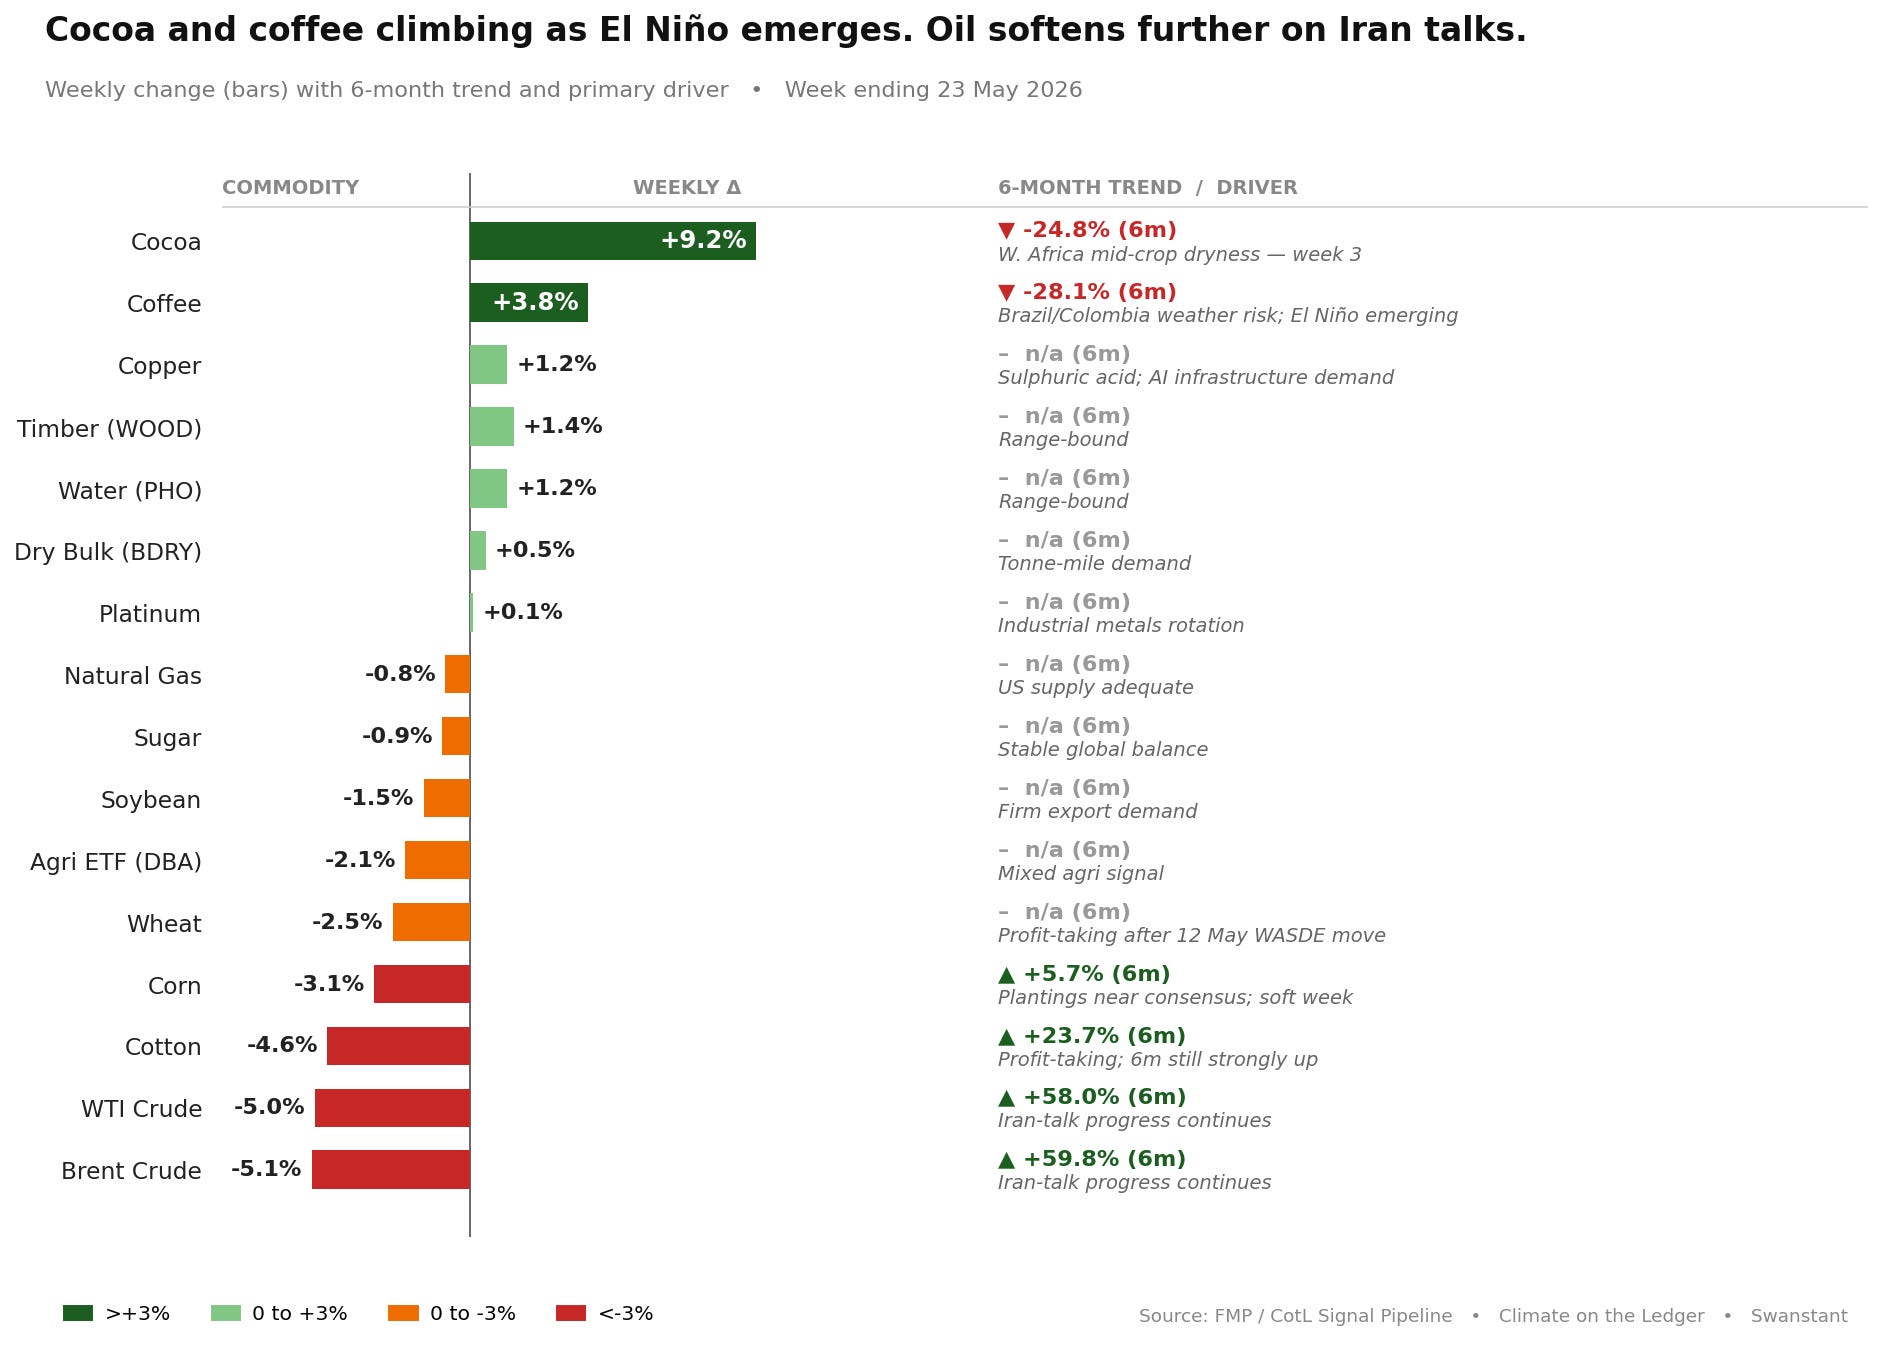
Commodity dashboard, week ending 23 May
Did you enjoy this edition, if yes let me know and share it with someone who would benefit from our weekly insights.